Windows Troubleshooting Series – Part 3 – Autoruns & ProcDump & LoadOrder & TCPView
Introduction
And here we are on the 3rd post: Introduction to Autoruns and ProcDump
The Sysinternals suite of tools is a collection of over 70 utilities that can be used to troubleshoot and diagnose a wide range of issues on a Windows system.
In this blog post we’ll focus on ProcDump and Autoruns.
Let’s start with a short instruction about these tools.
Autoruns
This tool allows you to view all the programs that are configured to run automatically when the system starts up. This can be helpful when trying to identify malware or other unwanted software that is running on the system.
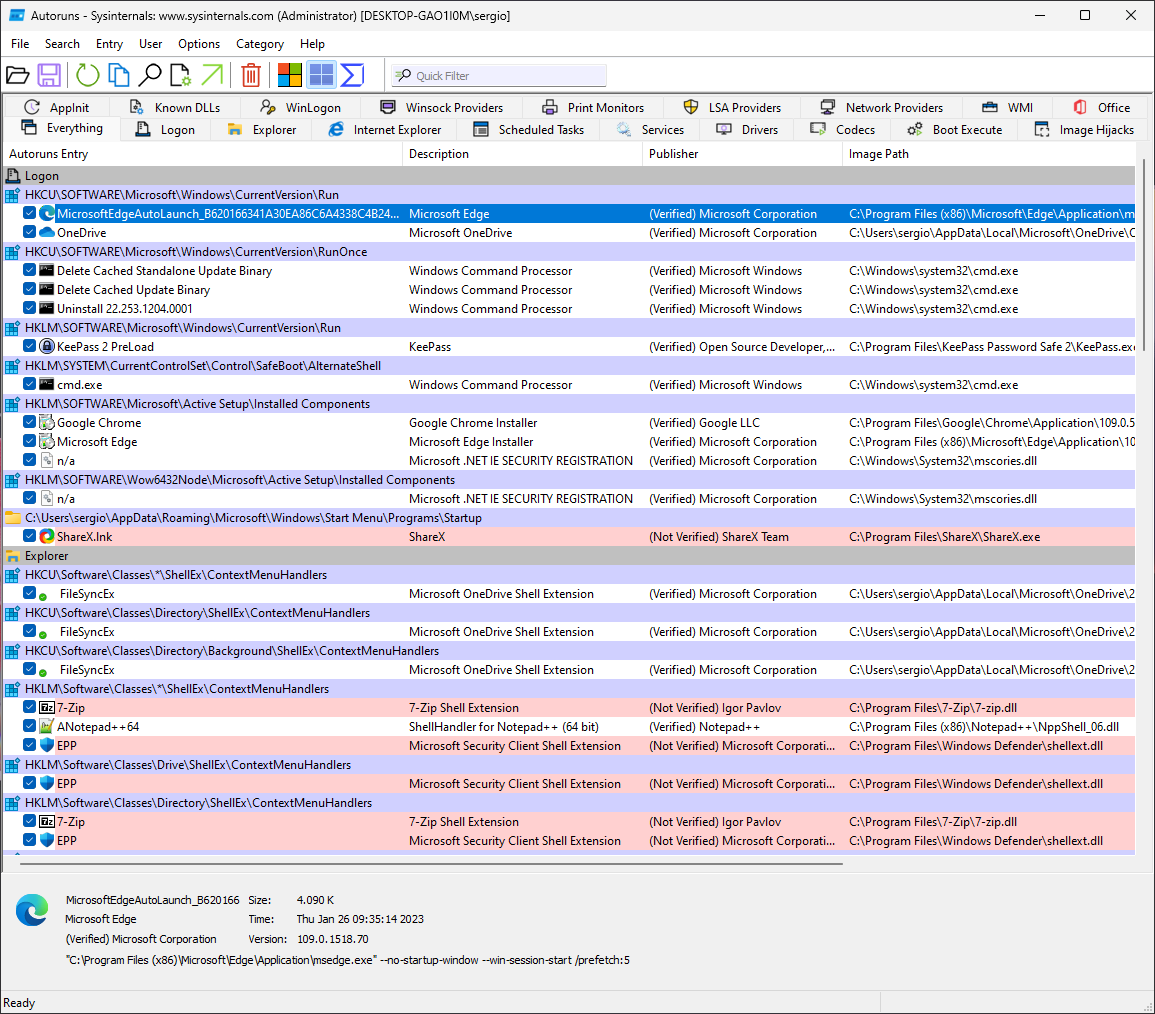
As we’ve done for previous tools, let’s start with the main interface:

The software starts on the Everything tab, which includes all the records it has identified in the locations it scans (The full list of scanned locations can be found in the book recommended at the end), and as you can see there is a lot in even a recently created VM with basic applications.
The entries will be grouped by Location in which they’re defined and then additional information is organized by column:
- Autoruns Entry shows either the name of the Application being run (from the metadata) or the executable itself
- Description is taken from the Description version resource of the file.
- Publisher same as above unless the file has a valid code-signing certificate, in which case the name shown is taken directly from the Certificate’s Subject Name.
- The Image Path is the full path to the file to be executed
- The Timestamp column displays the creation date and time of Portable Executable (PE) files in the local time zone. For non-PE files like script files, it shows the last-write time of the file. For shaded ASEP entries, it reflects the last modification time of the registry key or directory.
Note: Autoruns highlights in pink images if they have no Description/Publisher or certificate is not present or unverifiable.
Additional information can be gleamed from the file by clicking on it:

If you want to see additional file information you can doubleclick an entry:

And if you want to go to the location where the entry is configured you can right-click -> Jump to Image, same as in Process Monitor:

Additional options will be discussed a bit later in the article, for now let’s continue on the tabs:
Logon

The standard autostart entries processed during Windows start and user logon are listed in this tab of Autoruns, including popular ASEPs like registry Run and RunOnce keys, Start menu Startup directories, computer scripts, and user session processes like Userinit and desktop shell. These entries cover both per-user and system-wide locations, and are controllable through Group Policy. Additionally, the tab lists the Active Setup/Installed Components keys, which are used in the wild despite having never been documented/supported.
Explorer

The Explorer tab in Autoruns lists common autostart entries that hook into Windows Explorer, running in-process with Explorer.exe. There are both system-wide and per-user entries, including Shell Extensions (context menus, property pages, folder, window displays, ecc..), Namespace Extensions (Desktop, Control Panel, Recycle Bin and third-party), Pluggable Namespace Handlers which handle protocols (http/s, ftp, mailto, ecc…) or Microsoft/third party extensions (about, mk, res) and Pluggable MIME filters.
Note: DLLs can be loaded only in processes that equal their architecture, so a 32-bit DLL can only be loaded in a 32-bit process. Since explorer.exe is running as a 64-bit process on 64-bit Windows, this means that only 64-bit dll extensions can be loaded into it.
Internet Explorer

With the removal of IE in the latest updates this tab is much less important, but this tab shows the entries that concern Browser Helper Objects (BHOs) which are used to extend the functionality of Internet Explorer (for example with toolbars, custom menus/buttons and integration with other document readers like Adobe).
Scheduled Tasks

This tab shows the programs/scripts/actions that are being launched through the Windows Task Scheduler.
Services

Windows services run as background processes controlled by Service Control Manager, and can start without user login. They can share a single process, like Svchost.exe which hosts multiple services. The Autoruns’ Services tab lists active (not disabled by Autoruns) services and their configuration details, including start type, description, and executable path. The description comes from the registry key’s Description value. The executable path shows the service executable or target DLL. Some services require admin rights to view the Parameters key, in which case Autoruns shows the path to Svchost.exe.
You can disable a service by unchecking the box on the left, but be aware that it will not stop the service if it’s already running.
Drivers

The Drivers tab lists Windows drivers found in HKLM\System\CurrentControlSet\Services and HKLM\Software\Microsoft\Windows NT\CurrentVersion\Font Drivers, which run in kernel mode and are a critical part of the OS. Drivers interact with hardware, are used by security software and malware, and have .sys file extension. The tab displays non-disabled drivers unless disabled by Autoruns. Description is from the driver’s version resource and image path points to the driver’s location.
Drivers are statistically one of the most common causes of BSODs, so this is an important tab to check in case of crashes.
Codecs

The Codecs category lists entries that can be loaded by media players.
Note: Modern players like MPC-HC and VLC generally have the codecs directly integrated within the application so, unless you’ve hidden Microsoft codecs, you’ll only see entries in here if you have additional filters installed like MadVR or AC3Filter:

Boot Execute

The Boot Execute tab lists Windows native-mode executables that run during system boot via the Session Manager (Smss.exe). Tasks such as hard-drive verification and repair are performed during this time. Execute, S0InitialCommand, and SetupExecute entries should remain empty after Windows installation.
Image Hijacks

The Image Hijacks tab displays redirections of programs you specify and expect to run. It lists four types of such hijacks:
-
exefile changes the association of .exe or .cmd file types with an executable command. This can be changed through the registry but not through Windows file-association user interfaces. It has both per-user and system-wide versions.
-
htmlfile changes the association of .htm or .html file types with an executable command. Some malware hijacks these when you open an HTML file, so it’s important to verify the executable is a legitimate browser.
-
Command Processor\Autorun executes a command every time a new Cmd.exe instance is launched. It has both per-user and system-wide variants, and a separate version for 32-bit Cmd.exe on 64-bit Windows.Image File Execution Options (IFEO) is used for internal and undocumented purposes. It also allows specifying an alternate program to run when a specific application is launched. By creating a subkey with the original program’s file name and adding a “Debugger” value pointing to the alternate program’s executable path, the alternate program is started instead and receives the original program’s path and command line. Originally intended for use with debuggers, there is no requirement for the alternate program to be a debugger or to even use the passed command line.
Appinit

AppInit DLLs are DLLs specified in the Appinit_Dlls registry key which are automatically leaded in every process that loads User32.dll (all user-mode windows processes).
Due to both stability and security-related issues they’re deprecated and are disabled by default in Windows Vista and newer.
Known DLLs

These DLLs are automatically mapped by the Session manager during boot which will ensure that all processes requiring one of these DLLs will load them from this location rather than using the Windows DLL search order.
Winlogon

This tab displays entries that hook into Winlogon.exe, the process that manages the interactive-logon user interface. These are credential providers, user’s configured screensaver and registered Group Policy client-side extensions (DLLs that the Group Policy engine loads).
This list will generally be empty if you hide Windows entries:

Winsock providers

Windows Sockets (Winsock) is a flexible application programming interface (API) in Windows operating system that allows third-party developers to extend its capabilities. They can achieve this by adding transport service providers that can interface Winsock with other protocols or integrate additional layers on top of existing protocols, such as proxying. Third-party developers can also enhance Winsock’s name resolution facilities by adding a namespace service provider.
The service providers are integrated into Winsock through the Winsock service provider interface (SPI). When a transport service provider is registered with Winsock, Winsock uses the provider to carry out socket functions such as connecting and accepting connections, for the address types that the provider supports. There are no limitations on the implementation of these functions, but it typically involves communication with a transport driver in kernel mode.
Print Monitors

The entries displayed on the Print Monitors tab are Dynamic Link Libraries (DLLs) that are configured within the subkeys of HKLM\System\CurrentControlSet\Control\Print\Monitors. These DLLs are loaded into the Spooler service, which operates under the Local System account.
LSA Providers

This tab shows packages that extend or define user authentication through the Local Security Authority (LSA). It will also show registered cryptographic providers through the SecurityProviders key.
This list should generally only contain Microsoft-signed entries.
Network Providers

This list contains providers handling network communication, such as SMB, RDP, WebDAV and other network communication protocols. This list generally should only contain Microsoft-signed entries.
WMI

This tab lists registered WMI event consumers, which can be configured to execute a command or script using an event as trigger.
Office
 This tab lists Office addins and plugins.
Now, let’s move on to the most important options:

As can be seen in the image, Autoruns is able to hide Empty locations, Microsoft entries (which will hide also Windows entries), Windows Entries and VirusTotal Clean Entries (if VirusTotal scanning is enabled).
The next step is Scan Options:


Here we can see the option to scan only user locations, verifying code signatures, check VirusTotal for the files’ hash and if, the file is not present in VT, to upload it for analysis.
Going left one entry is the User choice which allows to define the user for which you would like to analyze the startup entries:

And in case you have done an export on an offline system (possibly by using autorunsc.exe from command line, not covered here) and you’d like to compare it with a “known good” live system you can use this option:

Demo
And now let’s do a short demo. Let’s say I want to check for any weird startup entry that might be malware and disable it.
Since “Microsoft products never have problems” (/s of course) we’ll start with ensuring that Code Signature Verification is enabled and we’ll enable “Check VirusTotal.com” as well

Note: If you haven’t already accepted the VT terms of service you’ll now be asked to accept them.
Then we’ll hide Microsoft Entries

And the entries identified as clean by VT:

And here we have one result that has been found to be malware by one of the many antivirus engines that VT uses:

Generally if only one engine identifies something as malware it’s a false positive but here for the sake of the demo we’ll assume it’s malware and we’ll disable it:

Now, let’s see what happened with ProcMon:

As we can see Autoruns creates a duplicate of the registry key in a sub-key called AutorunsDisabled and then deletes the original. Windows won’t run the entries within the AutorunsDisabled sub-key, which means that the entry is effectively disabled without actually deleting it from the registry.

The reason this is done with most entries is that Windows has very few autoruns types that support disabling (mainly Services), and as such Mark had to find a workaround. A workaround that works very well!
PsExec
PsExec is a tool that allows you to execute processes on one or more remote computers. It redirects the input and output streams of console applications, making it seem as though they are running locally, similar to a Telnet session. With PsExec, you can remotely enable console utilities that would normally only operate on the local computer. This feature can be particularly useful when you want to run a command prompt on a remote system and interact with it as though it were on your local computer.
You can also use PsExec to run programs locally or remotely as the System account, either interactively or non-interactively. For instance, you can run the Registry Editor (Regedit) and access registry key hierarchies, such as HKLM\SAM and HKLM\Security, which are only available to the System account. PsExec also provides several options to control how the local or remote target process should run, including user account, privilege level, priority level, and CPU assignment.
Currently PsExec is considered “deprecated” and Powershell’s Remote Session feature is the recommended solution for remote actions via command line, but it’s still very useful for some specific actions that Invoke-Command is unable to handle, like running actions as System, or if Powershell Remoting is not enabled on the remote machine.
If you want to look into it deeper take a look at the book Troubleshooting with Windows Sysinternals or to Adam Bertram’s blog post: https://adamtheautomator.com/psexec/
LoadOrder
LoadOrd is a very simple utility that shows the aproximate order in which Windows loads drivers and starts services:

Note: this is aproximate based on the configuration set in the registry. If you require the chronological order in which services/drivers are loaded in Windows during a real boot then tools like Windows Performance Toolkit (included within the Windows Development Toolkit mentioned in the previous post) or ProcMon are a better option.
TCPview
TCPView is an utility that shows a realtime listing of all the open sockets on the system with their status and the application using them:

It’s generally used to identify which application is listening on which port, similar to linux’s netstat -tulpn but with much more information.
ProcDump
And here we arrive at the final Sysinternals tool covered by this series and our bridge into Windows Debugging!
ProcDump is a powerful console tool that allows you to monitor processes and create user-mode dump files of those processes based on specific criteria such as high CPU or memory utilization, exception handling, unexpected termination, non-responsive user interface, or exceeding performance counter thresholds. It can capture a single instance or multiple instances of the same issue and generate immediate or periodic dumps.
Additionally, ProcDump can be registered as an AeDebug (auto-enabled debugger) crash handler that is activated by Windows whenever a process encounters an unhandled exception.
If you are using ProcMon, ProcDump can also send its findings to ProcMon, providing a unified view of the file, registry, process, network events, as well as CPU spikes, exceptions, nonresponsive windows, debug output, and other conditions. The dumps saved by ProcDump can be in the form of standard minidumps or full memory dumps, and the new “Miniplus” dump type provides a smaller dump size for large processes such as Microsoft Exchange Server and SQL Server, without sacrificing the ability to effectively analyze the data.
ProcDump is an ideal solution for capturing data from problematic processes that are difficult to isolate and reproduce, as it has minimal impact on the system while monitoring the process and does not terminate the monitored process, allowing you to acquire dump files from production systems without disrupting service.
ProcDump is a console application and as such it’s run from the command line through parameters.
The full coverage of all command line options is out of scope for this but we’ll cover the ones we’ll be using through the examples.
A comprehensive list of parameters can be found here: https://learn.microsoft.com/en-us/sysinternals/downloads/procdump
There are multiple ways of using ProcDump to get a dump of a process:
Register it as the default AeDebug handler
ProcDump can be set to automatically activate whenever a process crashes, allowing it to attach to the process and capture a dump. Windows has an unhandled-exception filter that is triggered when a thread encounters an exception it can’t handle. The default action is to launch WerFault.exe, which interacts with the Windows Error Reporting service. WerFault’s behavior can be managed through Group Policy or local registry settings. Usually, Windows records a minidump of the failing process along with related information and displays a message to the user for interactive processes. WerFault also verifies the existence of Auto and Debugger values in the registry at HKLM\Software\Microsoft\Windows NT\CurrentVersion\AeDebug (or HKLM\Wow6432Node for 32-bit processes on 64-bit Windows). These values are not present by default. If the Auto value is set to 1, WerFault executes the command specified in the Debugger value, substituting variables in the command line with the PID of the crashing process, an event handle to signal when the debugger is done, and an optional third value indicating a virtual memory address in the target process with further information about the exception.
The following command can be used to register ProcDump as the default crash handler for Windows Applications:
procdump.exe -i $DumpFolder [-ma | -mp ]
- $DumpFolder is the folder to which you would like the dumps to be saved. If not specified procdump will save them to the current directory of the console
- -ma or -mp identify respectively a Full Dump (the full memory of the process) or a Mini Plus dump file, which includes some additional process data compared to a Mini Dump. If neither -ma nor -mp are specified ProcDump will default to -mm which is the minidump. Additional information can be found here or in the book linked at the end of this post
To unregister ProcDump as the default crash handler the command is the following:
procdump.exe -u
Start monitoring and wait for process to start
procdump.exe [-f "" | -fx ""] -n $numberofcrashes -e [1] [-f] [-ma | -mp | -mm ] -w notepad $DumpFolder
- “[-f "” | -fx “”]" is the parameter to either only create a crash dump on a specific exception (-f) or to create a crash dump on all exceptions except for a specific one (-fx)
- “-n $numberofcrashes” is the parameter to indicate how many crash dumps should ProcDump capture. Default is 1.
- “-e [1]” is the parameter to indicate that ProcDump should capture a dump when an unhandled exception occurs, and if 1 is added ("-e 1") then it will also capture a dump on First Chance exceptions (an exception that the program might be able to handle itself). If “-f” is added then ProcDump will just monitor for exceptions and write them in the console without capturing dumps
- “-ma | -mp | -mm” as indicated above are the types of dumps that ProcDump should write
- “-w” tells ProcDump to wait for the process to start
- $DumpFolder is the folder to which you would like the dumps to be saved. If not specified procdump will save them to the current directory of the console
So, in summary, this command will start procdump, wait for the process notepad to start, capture a dump of that process either on first or second chance exception and save it in the $DumpFolder folder.
Start monitoring and start the process directly from the debugger
procdump.exe [-f "" | -fx ""] -n $numberofcrashes -e [1] [-f] [-ma | -mp | -mm ] -x $DumpFolder notepad.exe
- “[-f "” | -fx “”]" is the parameter to either only create a crash dump on a specific exception (-f) or to create a crash dump on all exceptions except for a specific one (-fx)
- “-n $numberofcrashes” is the parameter to indicate how many crash dumps should ProcDump capture. Default is 1.
- “-e [1]” is the parameter to indicate that ProcDump should capture a dump when an unhandled exception occurs, and if 1 is added ("-e 1") then it will also capture a dump on First Chance exceptions (an exception that the program might be able to handle itself). If “-f” is added then ProcDump will just monitor for exceptions and write them in the console without capturing dumps
- “-ma | -mp | -mm” as indicated above are the types of dumps that ProcDump should write
- “-x” tells ProcDump to start the process and monitor it from the debugger
- $DumpFolder is the folder to which you would like the dumps to be saved. If not specified procdump will save them to the current directory of the console
So, in summary, this command will start procdump, start notepad.exe from procdump, capture a dump of that process either on first or second chance exception and save it in the $DumpFolder folder.
Monitor an already running process
procdump.exe [-f "" | -fx ""] -n $numberofcrashes -e [1] [-f] [-ma | -mp | -mm ] [process_name | service_name | PID] $DumpFolder
- “[-f "” | -fx “”]" is the parameter to either only create a crash dump on a specific exception (-f) or to create a crash dump on all exceptions except for a specific one (-fx)
- “-n $numberofcrashes” is the parameter to indicate how many crash dumps should ProcDump capture. Default is 1.
- “-e [1]” is the parameter to indicate that ProcDump should capture a dump when an unhandled exception occurs, and if 1 is added ("-e 1") then it will also capture a dump on First Chance exceptions (an exception that the program might be able to handle itself). If “-f” is added then ProcDump will just monitor for exceptions and write them in the console without capturing dumps
- “[-ma | -mp | -mm]” as indicated above are the types of dumps that ProcDump should write
- [process_name | service_name | PID]
- $DumpFolder is the folder to which you would like the dumps to be saved. If not specified procdump will save them to the current directory of the console
So, in summary, this command will start procdump, attach itself to an already running instance of notepad.exe, capture a dump of that process either on first or second chance exception and save it in the $DumpFolder folder.
And as the post is approaching excessive lengths we arrive at the end of this overview!
Due to the analysis of a Crash Dump needing to be done in WinDBG we won’t be doing a Demo in this post, that will be done in the next post as we start covering debugging tools!
Hope you enjoyed and don’t hesitate to hit me up on Linkedin if you have questions or suggestions or if I wrote something incorrect!
Additional Resources
- https://learn.microsoft.com/en-us/sysinternals/resources/webcasts – The Case of the Unexplained speeches by the creator of the tools, Mark Russinovich. Amazing videos and even if old they’re very useful to understand how to apply these tools to troubleshooting!
- https://learn.microsoft.com/en-us/sysinternals/resources/troubleshooting-book – Troubleshooting With the Windows Sysinternals Tools. This book gives a cursory introduction to how Windows works under the hood and then details the use of each of the Sysinternals tools, parameter by parameter. And at the end there are more “Cases of the Unexplained”!
- https://learn.microsoft.com/en-us/sysinternals/resources/windows-internals This book will become more relevant in the 3rd blog post as we delve into WinDBG and Windows Debugging in general, but if you’ve ever wondered how Windows works under the hood, this is the book that will answer most (all?) of your questions!