Windows Troubleshooting Series – Part 4 - WinDBG
Introduction
And here we are with the 4th and last blog post of this series, the one covering the final debugging tool, the one you take out when nothing else works: Windows Debuggers!
Now, what is Debugging?
Debugging is the process of finding and fixing errors or bugs in software. It involves identifying the cause of the issue, determining how the issue is affecting the software, and then taking steps to correct the issue. Debugging can be done by a software developer, or by a dedicated debugging tool, and is an essential part of the software development process to ensure that the software works as intended and meets its requirements. The process of debugging can range from simple problem-solving techniques to complex analysis and testing.
As the focus of these series if posts is on troubleshooting rather than software development we’ll be focusing on the utility this tool can bring to IT Professionals rather than Developers.
There are multiple debugging tools available for Windows, but most of them rely on an underlying debugging library called Dbgeng.dll which is included in Windows (with the exception of the Visual Studio debugger). The most notable ones are:
-
CDB (Microsoft Console Debugger) is a powerful and simple to use user mode debugging tool for Windows, capable of analyzing both console and graphical Windows applications. It allows for live analysis of memory, can display and execute program code, set breakpoints, and examine/change values in memory. CDB also supports debugging multiple threads and processes, can analyze binary and source code, and is extensible. It is a character-based console program that can be used for low-level analysis and is useful for debugging both working and failing applications, and can be used across a network.
-
Microsoft Kernel Debugger (KD) is a character-based console program for in-depth analysis of kernel-mode activity on all NT-based operating systems. It is used for debugging kernel-mode components and drivers or monitoring the behavior of the operating system. KD supports multiprocessor debugging and requires two computers, a host computer and a target computer, for kernel-mode debugging.
-
WinDbg is a Windows-based debugger that supports both user-mode and kernel-mode debugging. It provides debugging for the Windows kernel, kernel-mode drivers, system services, as well as user-mode applications and drivers. WinDbg uses Visual Studio debug symbols for source-level debugging, can view source code, set breakpoints, view variables, stack traces, and memory. Its Debugger Command window allows a wide range of commands to be issued. For kernel-mode debugging, two computers are typically required (host and target). Remote debugging options are available for both user-mode and kernel-mode targets. WinDbg is a graphical-interface alternative to CDB/NTSD and KD/NTKD. This will be the tool we’ll be focusing on in this post.
Additional information can be found here: https://learn.microsoft.com/en-us/windows-hardware/drivers/debugger/debuggers-in-the-debugging-tools-for-windows-package
Note: As I’m not an expert of this product and haven’t used it extensively this will be only a fairly superficial overview. Additional reading materials will be provided at the end of this post for deeper diving.
Prerequisites
Before we can use the application we have to install it and configure it.
To do so first create a folder to store the downloaded symbols:

In this case I’m using C:\Temp\Symbols.
Then open the Windows Environmental Variables either manually or by using the command
rundll32.exe sysdm.cpl,EditEnvironmentVariables
Then click on “New”

Add the following strings:
Variable name: _NT_SYMBOL_PATH
Variable value: srv*C:\Temp\symbols*https://msdl.microsoft.com/download/symbols
And click OK

Click OK again to close the window:

Now, before we configure the Sysinternals suite with the newly configured symbol paths we need to install the correct version of the Windows Software Development Kit.
It can be downloaded from here if you have the latest version of Windows: https://developer.microsoft.com/en-us/windows/downloads/windows-sdk/
Or from here if you have an older version of Windows: https://developer.microsoft.com/en-us/windows/downloads/sdk-archive/
Once downloaded open it, select the first option and click Next:

Accept the Privacy Policy and the License Agreement and then click next:


Here select only “Debugging Tools for Windows” and then click on “Install”:

Now open WinDBG:

This will be the window you’ll see:

You can add additional windows with information by clicking on these buttons:

That said, I recommend installing one of the following themes which will make life much easier (and, more importantly, more pleasant): https://github.com/lololosys/windbg-theme
For the duration of this post I’ll be using the dark theme:

Now, let’s configure Symbols:

And then add the same string you’ve configured previously:

If you have the application’s source code you can also point to it:

And now we should be ready to play!
Basics of Windows Architecture
Windows operates in two distinct processor access modes to safeguard critical operating system (OS) data from being accessed or altered by user applications. These modes are known as user mode and kernel mode.
Applications run in user mode, while the OS code, such as system services and device drivers, operates in kernel mode. In kernel mode, a processor grants access to all system memory and all CPU instructions. This mode is also referred to as code privilege level, ring level, or supervisor mode by different processors. By giving the OS kernel a higher privilege level than user mode applications, the processor helps to prevent a misbehaving application from disrupting the overall stability of the system.
While each Windows process has its own private memory space, the kernel-mode OS and device-driver code share a single virtual address space. Each page in virtual memory is tagged to indicate the access mode required to read or write the page. Pages in system space are only accessible from kernel mode, while all pages in user address space are accessible from both user and kernel modes. Read-only pages, such as those containing static data, are not writable from any mode.
In processors that support no-execute memory protection, Windows marks data pages as non-executable to prevent accidental or malicious code execution in data areas. This feature, known as Data Execution Prevention (DEP), is enabled if supported by the processor. However, Windows does not provide protection for private read/write system memory being used by components in kernel mode. This means that once in kernel mode, the OS and device-driver code have complete access to system-space memory and can bypass Windows security to access objects.

As we can see in this diagram, there are a few types of user-mode processes:
- User Processes: These can be classified into two types: Windows 32-bit or 64-bit and Windows 3.1 16-bit or MS-DOS 16-bit. It is important to note that 16-bit applications can only run on 32-bit Windows. Windows Apps running on Windows 8 and later operating systems are included in this category and are running on top of the Windows Runtime.
- Service Processes: These processes host Windows services, such as Task Scheduler and Print Spooler. They are designed to run independently of user logons and are commonly used by Windows server applications.
- System processes: These are integral parts of the operating system that are built into the system and run automatically. Examples of system processes include the logon process and the Session Manager. Unlike Windows services, these processes are not started by the Service Control Manager and are considered “hardwired” into the system.
- Environment Subsystem Server Processes: These processes provide support for accessing a subset of the native services in Windows. This was used in the past to allow POSIX/UNIX code to run in Windows, but is now used mostly for the command line interaction with Windows (cmd.exe) through the conhost.exe executable
- Subsystem DLLs: Under Windows, user applications do not interact directly with the native Windows OS services. Instead, they go through one or more subsystem dynamic-link libraries (DLLs). The role of these DLLs is to translate a documented function into the appropriate native system service calls implemented in Ntdll.dll. This translation may or may not involve sending a message to the environment subsystem process serving the user process.
And a few kernel-mode components:
- Executive: The Windows executive is the core component of the operating system and provides the base OS services such as memory management, process and thread management, security, I/O, networking, and inter-process communication.
- The Windows kernel: This component is responsible for low-level OS functions, such as thread scheduling, interrupt and exception dispatching, and multiprocessor synchronization. Additionally, it provides a set of routines and basic objects for the rest of the executive to implement higher-level constructs.
- Device drivers: The device drivers are responsible for managing the I/O operations of hardware and non-hardware devices. Hardware device drivers translate the user I/O function calls into specific hardware device I/O requests, while non-hardware device drivers, such as file system and network drivers, manage the I/O operations of the corresponding devices.
- The Hardware Abstraction Layer (HAL): The HAL is a layer of code that acts as a bridge between the hardware and the rest of the operating system. It isolates the kernel, device drivers, and the rest of the Windows executive from the platform-specific hardware differences such as those found between motherboards.
- The windowing and graphics system: This component is responsible for implementing the graphical user interface (GUI) functions such as dealing with windows, user interface controls, and drawing. It is better known as the Windows USER and GDI functions.
- The hypervisor layer: The hypervisor layer is a single component that is composed of the hypervisor itself. This layer does not have any drivers or other modules but the hypervisor itself is composed of multiple internal layers and services. These services include the memory manager, virtual processor scheduler, interrupt and timer management, synchronization routines, partition management, inter-partition communication (IPC), and more.
Now that the introduction is done, let’s dive in WinDBG
Types of Debugging
User Mode Debugging
Applications and subsystems on the computer run in user mode. Processes that run in user mode do so within their own virtual address spaces. They’re restricted from gaining direct access to many parts of the system, including system hardware, memory that isn’t allocated for their use, and other portions of the system that might compromise system integrity. Processes that run in user mode are effectively isolated from the system and from other user-mode processes, so they can’t interfere with these resources.
Let’s try debugging the CrashMe application (credits: http://windbg.info/apps/46-crashme.html):
First let’s start it:


And in WinDBG let’s attach our debugger to it:

Note: You can also start your application directly from the debugger by choosing the “Open Executable” option.
To find it we’ll sort by Executable:

We select the application and then click ok:

The debugger will now attach itself by adding a new thread to the process and then break on its own stack trace:

We can see this with Process Explorer as well:

Now, the application is paused and we can’t do anything in it, but we want to continue, so we’ll write g and then enter to allow it to continue running:

Note: a complete list of WinDBG commands can be found here: http://windbg.info/doc/1-common-cmds.html
And now we can interact again with it:

Now let’s cause an exception so we can analyse it:

No we see the debugger catching a first chance exception (an exception that might or might not be handled within the code) and stopping execution:

Now let’s see the threads running:

That thread 0 seems interesting, but before we switch to it let’s see all the call stacks:

And indeed we can see in the stack trace of thread 0 that the exception was raised by the function called CrashMe!CCrashMeDlg::OnBnClicked_RaiseExcpt+0x36
The culprit has been found!
Kernel-Mode Debugging
The operating system and privileged programs run in kernel mode. Kernel-mode code has permission to access any part of the system, and it’s not restricted like user-mode code. Kernel-mode code can gain access to any part of any other process running in either user mode or kernel mode. Much of the core OS functionality and many hardware device drivers run in kernel mode.
We won’t be covering Kernel-Mode debugging in this guide, but you can find a guide on how to attach a kernel debugger to a Hyper-V machine here: https://vimalshekar.github.io/reverse-engg/Kernel-Debugging-a-Hyper-V-VM
And on how to attach a kernel debugger via the network here: https://learn.microsoft.com/en-us/windows-hardware/drivers/debugger/getting-started-with-windbg–kernel-mode-
Dump File Debugging
Now we get to the type of debugging that we might be doing the most: an application keeps crashing and we don’t know what’s causing.
We’ve covered how to get dumps of a crashing application in the previous post so go back to that post for instructions.
Let’s open a dump file of the crashing application:

As you can see we’ve accumulated quite a list of them thanks to setting up ProcDump as the AeDebug crash handler!
We’ll open the latest one:
 .
.
Now that WinDBG has loaded the file it also helpfully points out that there is an exception of interest stored in it:

Let’s try using the automatic analysis function:

In that analysis we can see the comment from procdump:

The context at the time of the error:

The exception information:

The call stack:

The information from the symbols of the function that caused the crash:

Additional information about the module:

And additional information about the operative system at the time of the crash:

Now let’s say we want to analyze this ourselves:
Let’s start with .lastevent to check for call just before the catch (error handling) started processing:

And now .exr -1 to get the exception record:

It’s already fairly clear but let’s see if we can get more information about the error:

Not really that useful. Now let’s switch context and check the call stack:


Here we can see again that CrashMe!CCrashMeDlg::OnBnClicked_DivisionByNull+0x30 was the last instruction executed before the OS exception handler was started.
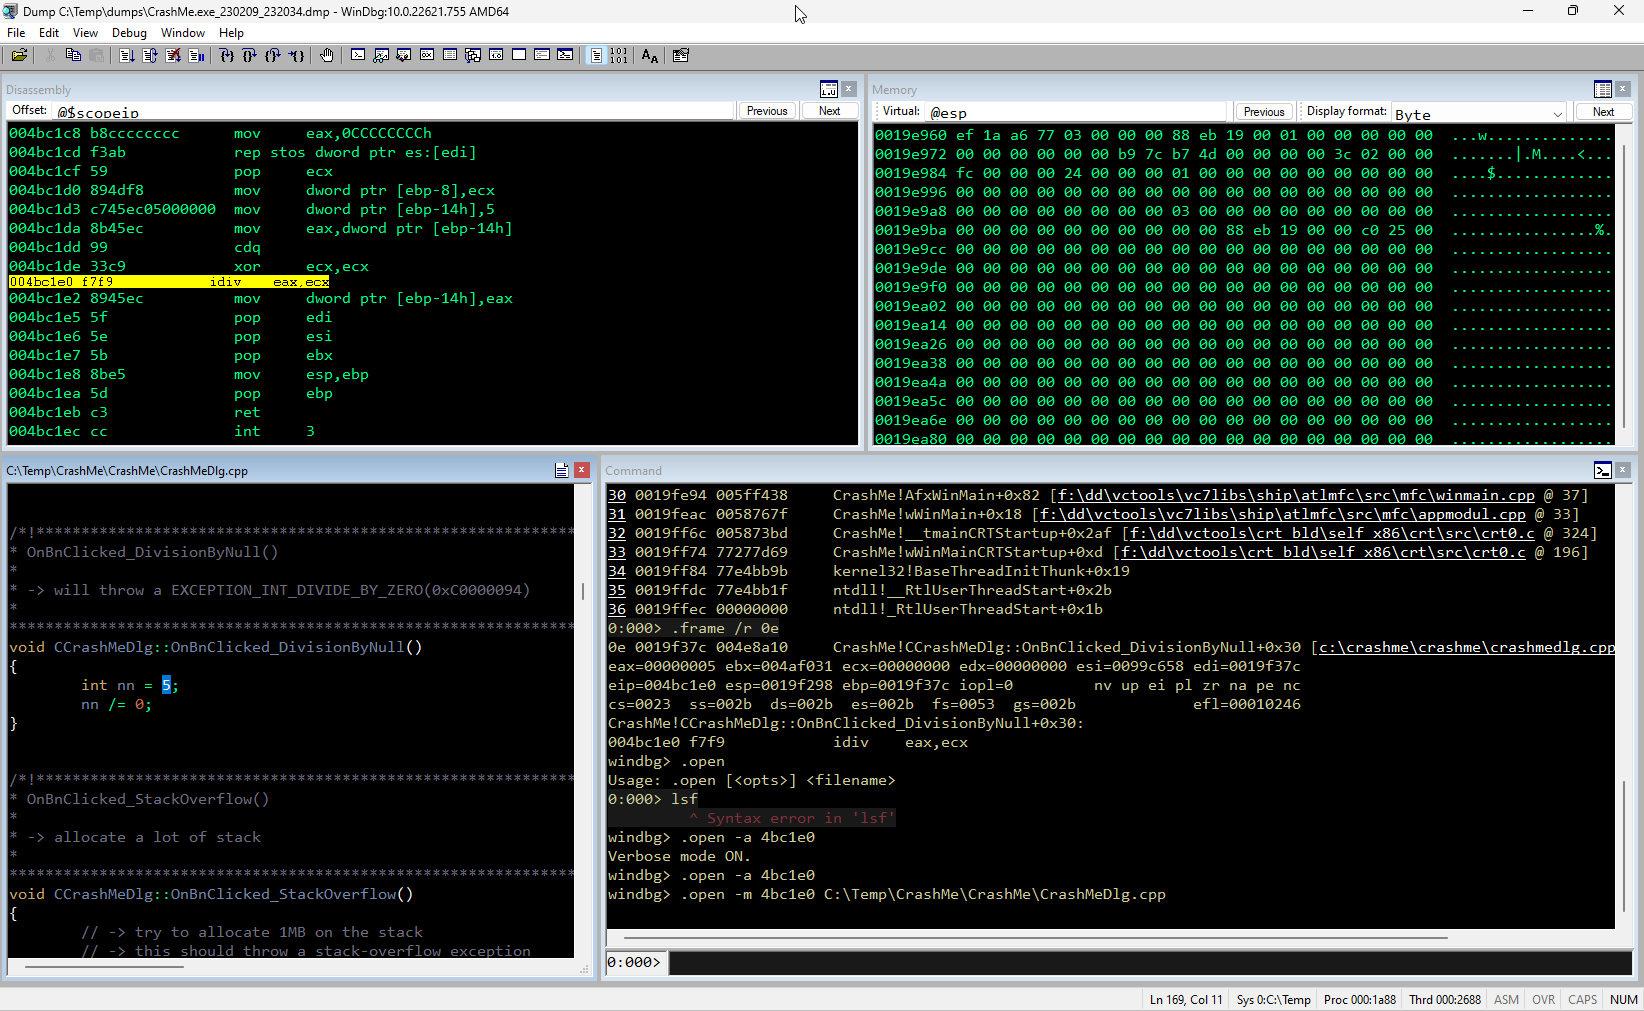
Now let’s see if we can get a bit more information about what the function was doing:

After clicking on the frame we can now see the assembly code for the execution in the Disassembly window with the operation highlighted:

As you can see it’s indeed a division operation. Now let’s see the values it was trying to divide:

And indeed the value of the eax register is 5 while the value of the ecx register is 0. So it was trying to divide 5 by 0 which is very much a bad idea! We can also confirm that by looking at the source code if we have that available:

And here we are with this short demo. This is obviously very simple and barely 10% of what WinDBG is capable of, so if you want to continue on this path of learning I recommend the following videos:
- https://youtu.be/52c1QIW6niE – How to use ProcDump to create dump files and analyze them with WinDBG (basic)
- https://youtu.be/2rGS5fYGtJ4 – Very comprehensive talk about Windows Debugging/Troubleshooting with WinDBG
- https://youtu.be/QuFJpH3My7A – Malware Analysis with WinDBG. While not directly applicable to using WinDBG for troubleshooting it’s still very useful to learn what can be done with the application, especially as far as memory analysis is concerned.
Conclusion
And with this we conclude the Windows Troubleshooting Series. I’ll probably be making more blog posts in the future with examples of troubleshooting (in the style of the Case Of The Unexplained series) but in the short term this is it for Windows Troubleshooting.
Hope you enjoyed and don’t hesitate to come back to my blog for more Microsoft content!
Resources
- https://learn.microsoft.com/en-us/sysinternals/resources/windows-internals If you’ve ever wondered how Windows works under the hood, this is the book that will answer most (all?) of your questions!
- https://www.amazon.com/Advanced-Windows-Debugging-Mario-Hewardt/dp/0321374460 Book written by Microsoft employees that goes in depth on Windows Debugging. While the explanations are fairly clear you may need to Goo… Bing quite a lot if you don’t have a programming background
- http://www.windbg.info/doc/2-windbg-a-z.html A presentation created more than a decade ago that gives an overview of Windbg
- http://www.windbg.info/doc/1-common-cmds.html Common Windbg commands in a easy to use table
- http://www.windbg.info/apps/46-crashme.html Application used to reproduce some errors to be able to analyze them
- WinDBG themes https://github.com/lololosys/windbg-theme
- WinDBG Commands (2): https://ikrima.dev/dev-notes/win-internals/windbg/
- https://learn.microsoft.com/en-us/windows-hardware/drivers/debugger/getting-started-with-windows-debugging Microsoft’s Getting Started with Windows Debugging
- https://vimalshekar.github.io/reverse-engg/Malware-Analysis-101 This post has a very good list of recommended books at the end
- https://www.youtube.com/playlist?list=PLhx7-txsG6t6n_E2LgDGqgvJtCHPL7UFu Introduction to WinDBG commands and their usage