Windows Troubleshooting Series – Part 2 – Process Explorer & Process Monitor
And here we are on the 2nd post: Introduction to Process Explorer and Process Monitor.
Before we start, repeat after me “When in doubt, run Procmon!”
Now that we’ve gotten the Russinovich mantra out of the way, let’s delve in!
The Sysinternals suite of tools is a collection of over 70 utilities that can be used to troubleshoot and diagnose a wide range of issues on a Windows system. In this blog post we’ll focus on Process Monitor and Process Explorer while Autoruns and Procdump will be covered in the next one.
Let’s start with a short instruction about these tools.
Process Explorer
Process Explorer is, as Mark Russinovich calls it, “Task Manager on Steroids”. It shows detailed information about all the running processes on the system, including resource utilisation (GPU, CPU, Memory, ecc…), Path, Signature, Threads and Stacks (though for a clear view of the stacks Symbols have to be configured and WinDBG installed. More on that later) and much more.
Let’s start with the main window:

As you can see Process Explorer presents columns detailing running processes on your system, including the parent/child relationships, CPU usage, memory data, PID, description, company name, certificate signature, and verification status. Additionally, you can see the path to the executable and color coding that identifies the process type and state, such as services, .NET processes, “Immersive” processes, suspended processes, processes running as the same user as Process Explorer, processes that are part of a job, and packed images. All of these columns are fully customizable to fit your needs:

You can get additional information about the process by putting the mouse cursor on top of it, and it even shows the services running within a svchost.exe instance:

On the top of the bar there is a menu with many different options, but the really interesting ones are these:

These allow you to configure Process Explorer to Run at Logon, Send the executable hashes to VirusTotal for verification (if you’re suspecting malware infection on the machine), Replacing Task Manager with Process Explorer (though I’ve had less than stellar success with that option on particularly problematic machines) and configure Symbols, which we’re going to look at further down in the article. You can also create a dump of a process for later analysis with tools like WinDBG:

Take the time to familiarize yourself with the different options, it will pay off in spades afterwards!
To see detailed information about a specific process double-click it (or right-click -> properties) and the following window will appear:

If you’re troubleshooting performance issues, the Performance

Performance Graph

Disk and Network

and GPU Graph

tabs can provide valuable insights.
There is also a tab that shows the current Network Connections:

One that shows the environmental variables used by the process:

The Security information:

The Strings (Printable strings found in the process image/executable or memory):

And the list of threads for that process:

Note: Threads are the “sub-processes” of the process, each dedicated to the execution of a specific action. They are created and destroyed regularly and return the information from the execution back to the main thread (the persistent one). More information on threads can be found in the “Windows Internals” and the “Troubleshooting with the Windows Sysinternal Tools” books.
You can also see the module (executable or dll on disk) used by that thread:

And, if you really want to know what’s the thread doing (and you have the necessary symbols loaded) you can open the stack (list of functions executed within that thread):

The stack is read from the bottom up, which means that in this case the thread started with ntdll.dll!RtlUserThreadStart+0x28, which then called KERNEL32.DLL!BaseThreadInitThunk+0x1d, which then called msedge.exe!__scrt_common_main_seh+0x106, ecc…
There is A LOT more to know about this application but going deeper is out of scope of this post, so if you want to learn more, check out the “Troubleshooting With the Windows Sysinternals Tools” book, linked at the end of the article.
And now for a simple demo! Problem: you need to delete a specific folder but when you try to do so you get this unhelpful message:

To find out which process is blocking the folder (or the file if it concerns a file) there is a moltitude of tools that can be used (Unlocker, Resmon, LockHunter, ecc…) but this is a post about Process Explorer so let’s find out how to do it with this application!
Open Process Monitor as Administrator then click on Find -> Find Handle or DLL:

Fill in the name of the folder/file and click on “Search”:

Voila!

Click on it to open the list of open handles:

Now you have two options:
- Closing the handle:

- Killing the process:

Generally it’s recommended to kill the process or restart the machine if possible as programs sometimes react in unpredictable ways if handles are interfered with, but if you can’t close the process then Close the Handle and keep deleting.
Voilà, the undeletable folder is now deleted!
Additional information about this demo and the impact of choosing the different options can be found here: https://youtu.be/7zu93I-xu6c?t=1105
Process Monitor
And here we arrive to the bread and butter of troubleshooting applications, and the reason the “When in doubt, run Procmon!” mantra exists: Process Monitor!
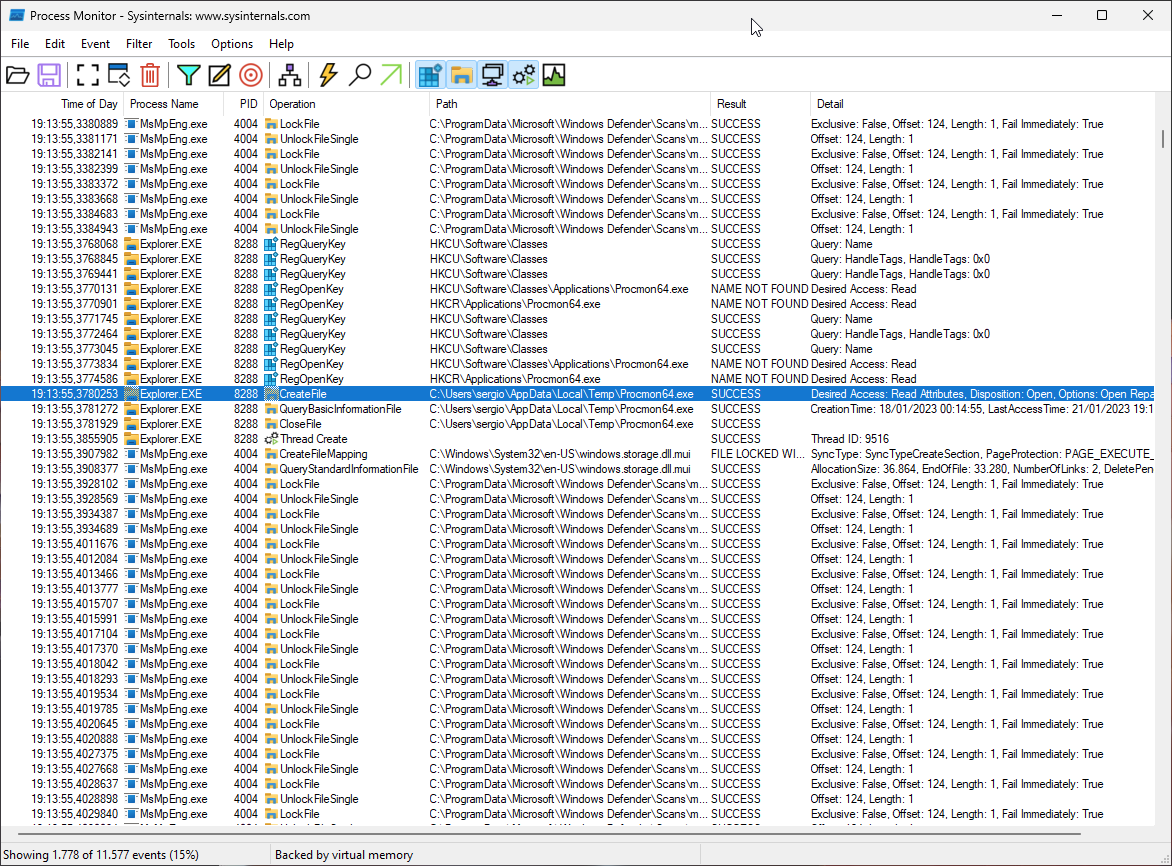
Process Monitor is an application that is able to show you a moving snapshot of the system as it effectively logs most actions a process does during its execution. It’s able to log file actions, registry actions, network traffic and quite a lot more, and as such it’s one of the most useful tools when trying to troubleshoot why an application might be misbehaving and it’s very often the last tool required to solve an issue due to the level of visibility it provides. Let’s start with taking a look at it’s main window:

On first start the columns shown are Time, Process Name, PID, Operation (acted upon an entity), Path (to the entity acted upon), the result of said action and the ever-important Detail column which contains additional information concerning the result of the Operation (for example the level of access requested for the operation or the resulting value if it concerns a query), but as usual the columns can be easily changed and adapted to your needs:

When started it immediately starts monitoring the system (unless /noconnect is used) and as you can see in the bottom left corner the events start piling up VERY fast, and as such filtering is critical to make proper use of this tool:

As you can see, the application already filters quite a bit of stuff by default, but you can (and should!) narrow it down further through the many options available for filtering. You can do it through the menu above or by right clicking on an event’s applicable column and then exclude (it excludes all events with that value from the results), include (filters all results BY that value. example: only shows results of the process MsMpEng.exe), Highlight it (To make it easier to see during analysis) or Copy (Copies the value to the clipboard:

When you see an interesting event and want to delve deeper double click it and you’ll be presented with this window:

You can also see information about the process at the moment this event happened:

And see the Stack trace at that point in time as well:

In addition to the Events logging and analysis in the main window ProcMon also includes additional tools to assist with diagnosis:

These additional functions are:
- Process Tree: Hierarchical view of the processes and threads for which events were recorded in the Procmon trace.
- Process Activity Summary: Table with process name, PID, CPU usage, file, registry and network events, commit peak and working set peak, and a graph of these numbers over the process timeline.
- File Summary: Information on file and directory operations by path, folder, and file extension and shows statistics such as I/O time, operations, and bytes read/written for each unique file system path.
- Registry Summary: Registry paths with statistics such as I/O time, operations, and sum total, and allows sorting and reordering columns
- Stack Summary: Common and divergent stack traces as expandable trees, displaying statistics such as execution count, time spent, and module/function information for each stack frame, and providing source file information if available. Note that it is not a comprehensive code coverage and profiling tool.
- Network Summary: TCP/UDP endpoints and ports with statistics on connects, disconnects, sends, receives, total events and bytes sent/received, and allows sorting and reordering columns, adding Path rule to filter and saving data to CSV.
- Cross Reference Summary: paths accessed by multiple processes, with columns showing the path, processes that wrote and read it, allows sorting, reordering and saving data to CSV and adding selected path to filter by double-clicking or clicking the Filter On Row button.
- Count Occurences: Selecting a column name and counting distinct values and number of events with current filter, allowing sorting and reordering columns, saving data to CSV and adding column/value rule to filter by double-clicking.
Note: This is a very brief summary of each function, they are covered in much deeper detail in the books indicated at the end of the post.
And finally an option that is very useful in case analysis needs to be done on something happening during boot is:

To use it you enable it, restart the computer to reproduce an issue and then open Procmon again to save the trace and analyse it.
And now a short example!
Let’s say that one day you open your (surely beloved) Adobe Acrobat and you get this error:

Which is already surprising since Acrobat usually crashes without an error, but we take what we can get!
Now, you could probably fix this by reinstalling Acrobat but you’re curious about what’s actually happening, and that’s where Procmon comes in!
Open procmon and start the trace

Then reproduce the issue:

Once you’re at the error message stop the trace

Now, the error says it failed to load its Core DLL, so let’s filter by that. Open the filtering menu:

And add as filters Process Name is “Acrobat.exe”, Operation is “CreateFile” (a function that is also used for read a file before loading) and Result is not “Success”:

And here we have a short list of DLLs that Acrobat was unable to load:

Now, the error appeared at the end so its probably the last 2 or 3 DLLs that are the issue but we can’t be sure, so let’s run a trace on a system that doesn’t have the issue:

Side by side comparison is showing that on the right side (broken) there is one more DLL that wasn’t found: ACE.dll. Is that it? Let’s check with the File Summary function:

We’re looking at paths that are only present on the right side, so the 2 that interest us are ACE.dll and imageres.dll. imageres.dll is a Microsoft DLL that’s usually present in C\Windows\System32 so it’s not part of Adobe Acrobat. ACE.dll is an Adobe dll though, as we can see on the unaffected machine:

Now let’s copy this DLL from the functioning machine to the non-functioning one and voilà, Acrobat Opens again!

Sadly. Could have been a good opportunity to suggest alternatives to management if it remained broken…
Anyway for more examples take a look at the “Case of the Unexplained” videos at the end of this post!
Configuring Symbols
As mentioned previously most of the useful information in Stack traces can only be gleamed if the correct symbols and debugging dll are installed.
To do so first create a folder to store the downloaded symbols:

In this case I’m using C:\Temp\Symbols.
Then open the Windows Environmental Variables either manually or by using the command
rundll32.exe sysdm.cpl,EditEnvironmentVariables
Then click on “New”

Add the following strings:
Variable name: _NT_SYMBOL_PATH
Variable value: srv*C:\Temp\symbols*https://msdl.microsoft.com/download/symbols
And click OK

Click OK again to close the window:

Now, before we configure the Sysinternals suite with the newly configured symbol paths we need to install the correct version of the Windows Software Development Kit.
It can be downloaded from here if you have the latest version of Windows: https://developer.microsoft.com/en-us/windows/downloads/windows-sdk/
Or from here if you have an older version of Windows: https://developer.microsoft.com/en-us/windows/downloads/sdk-archive/
Once downloaded open it, select the first option and click Next:

Accept the Privacy Policy and the License Agreement and then click next:


Here select only “Debugging Tools for Windows” and then click on “Install”:

Once installed open Process Explorer -> Options -> Configure Symbols

For the Dbghelp.ddl path click on the 3 points on the right

Navigate to C:\Program Files (x86)\Windows Kits\10\Debuggers\x64 and select dbghelp.dll:

For the Symbols as you notice they’re automatically picked up from the PATH Variable we configured previously, so you can click OK.
Note: This configuration is not shared between Sysinternals tools, so you’ll have to configure each of them separately.
And here we are at the end of this very long post. Hope you enjoyed and don’t forget to check back for the next one!
Additional Resources
- https://learn.microsoft.com/en-us/sysinternals/resources/webcasts – The Case of the Unexplained speeches by the creator of the tools, Mark Russinovich. Amazing videos and even if old they’re very useful to understand how to apply these tools to troubleshooting!
- https://learn.microsoft.com/en-us/sysinternals/resources/troubleshooting-book – Troubleshooting With the Windows Sysinternals Tools. This book gives a cursory introduction to how Windows works under the hood and then details the use of each of the Sysinternals tools, parameter by parameter. And at the end there are more “Cases of the Unexplained”!
- https://learn.microsoft.com/en-us/sysinternals/resources/windows-internals This book will become more relevant in the 3rd blog post as we delve into WinDBG and Windows Debugging in general, but if you’ve ever wondered how Windows works under the hood, this is the book that will answer most (all?) of your questions!
- https://youtube.com/playlist?list=PLLhSArDiaW6IgzMYEMaEf_BF2yQN40fIm 25th Sysinternals anniversary videos from the team behind the Sysinternals tools, with each expert covering one of the tools
- https://youtube.com/playlist?list=PLSTO76Gp9qyfLOL5mLpDZWOmJ5hz3VWTs – Playlist on the Sysinternals tools from Paul Offord, containing also instructions on how to use Procmon and Wireshark together and match their outputs